Hi, this is Lizzy from Dinosaw ( Not a Robot ). Which Machine ( model ) do you want? Please WhatsApp us now
An executive guide to scaling block-to-slab conversion. Distilled insights on value levers, pilot roadmaps, and risk boundaries for multi-blade stone block cutting machines.
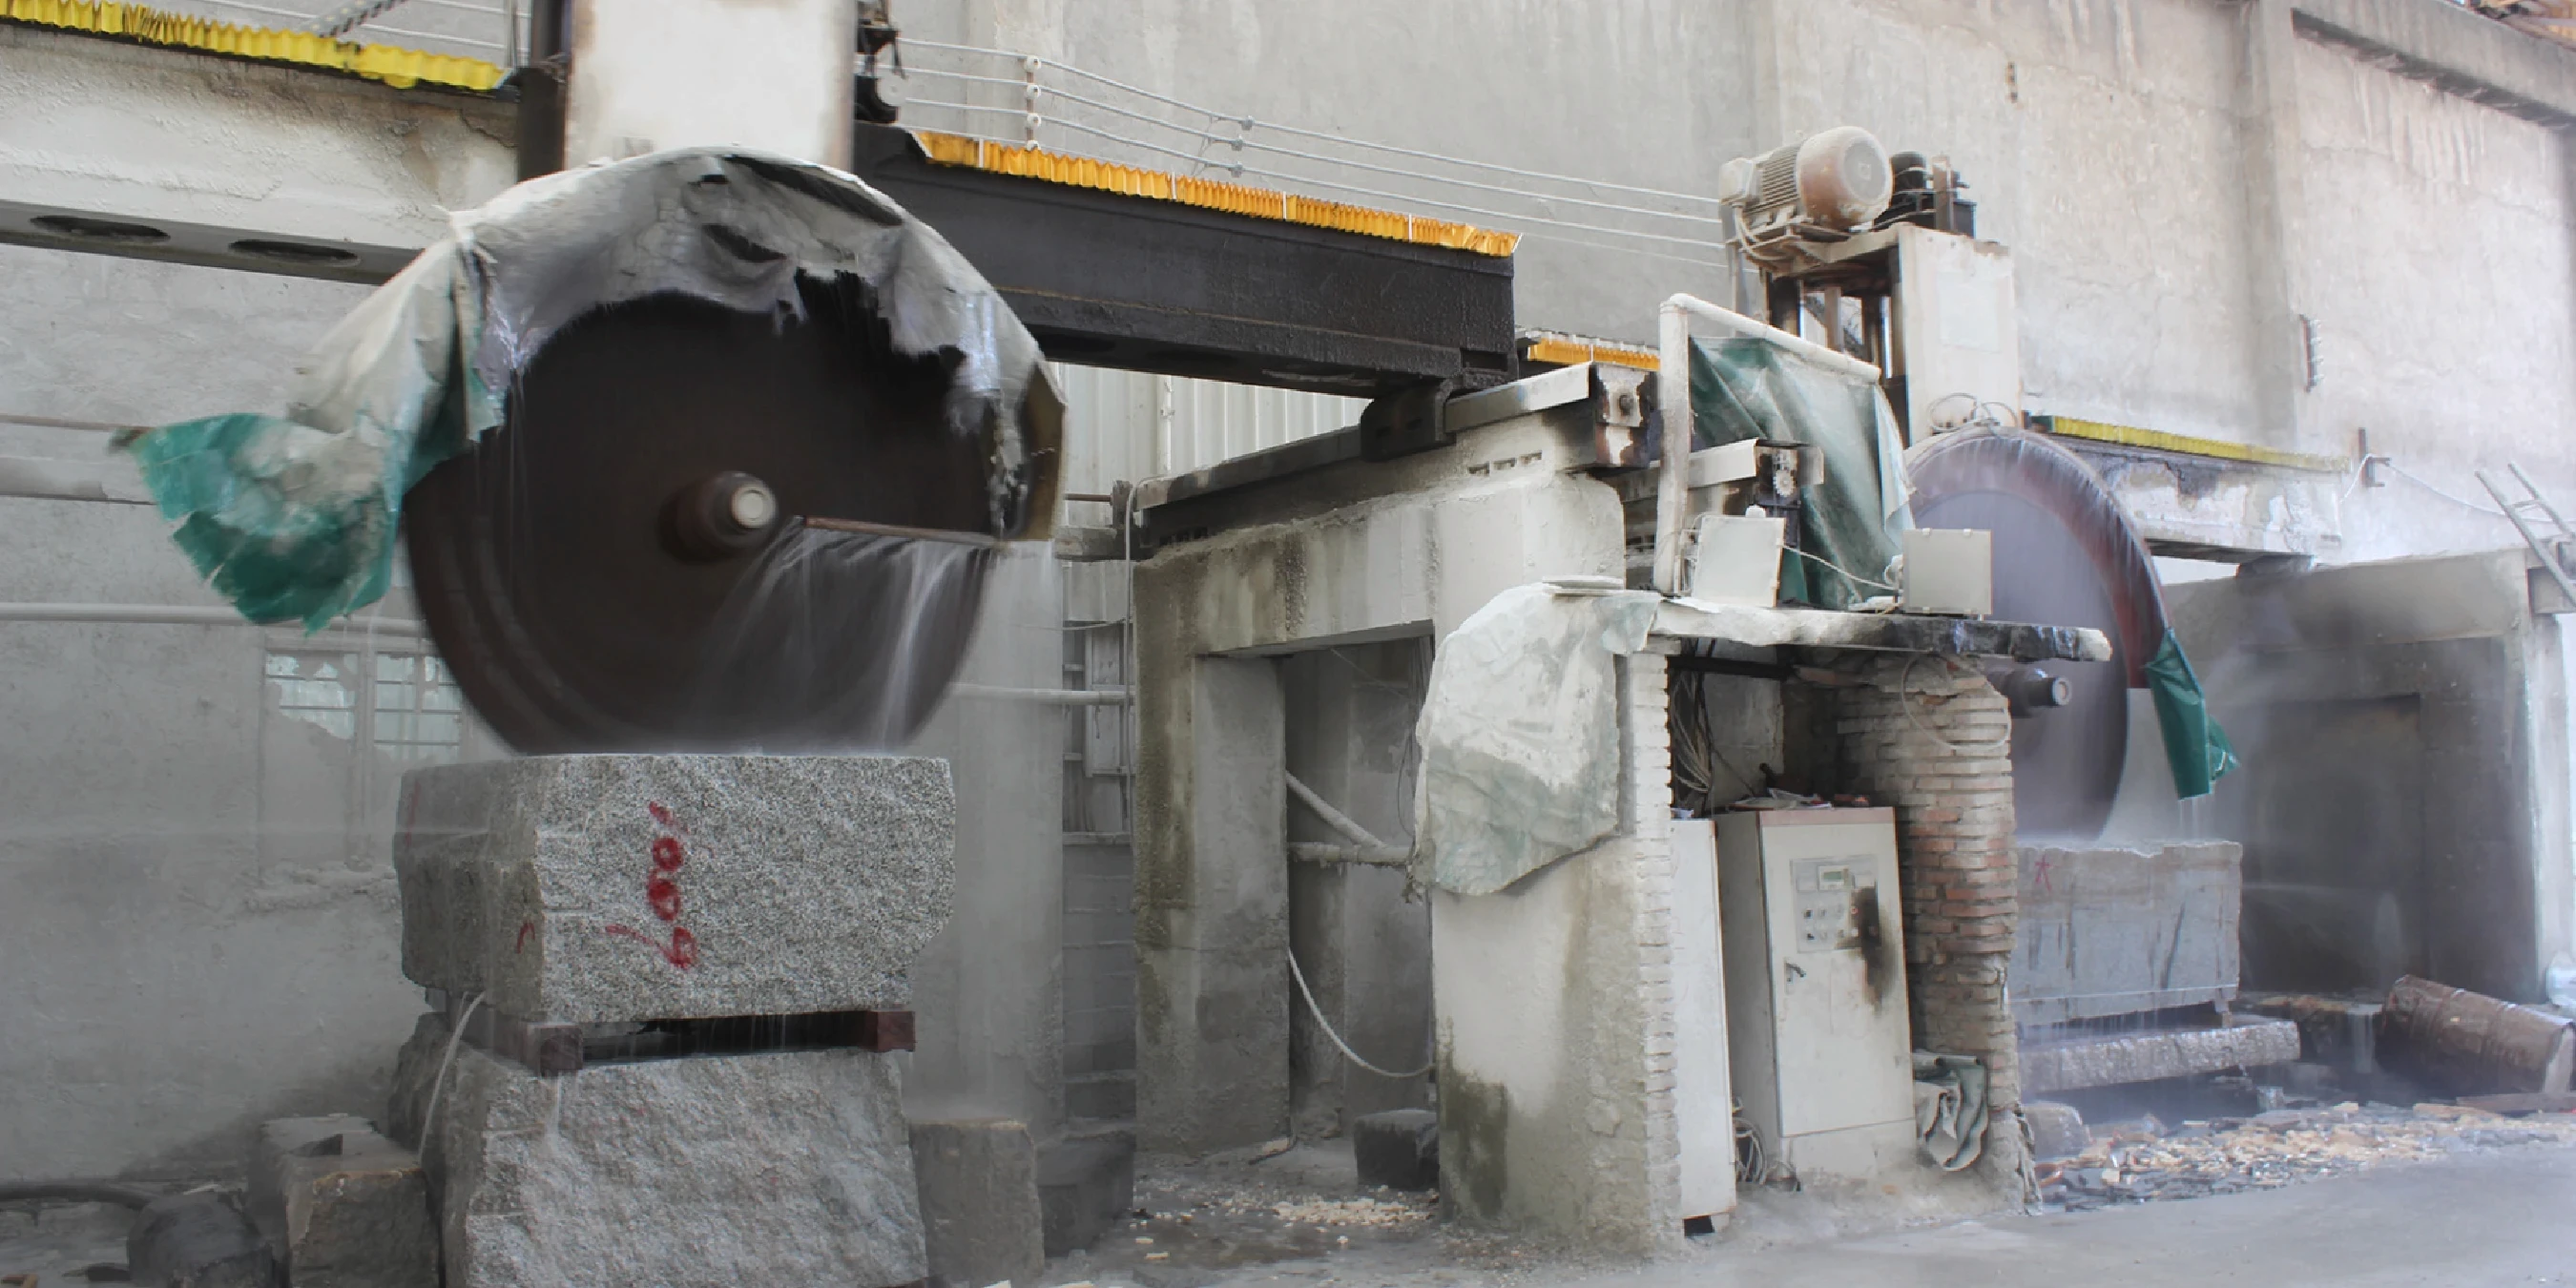
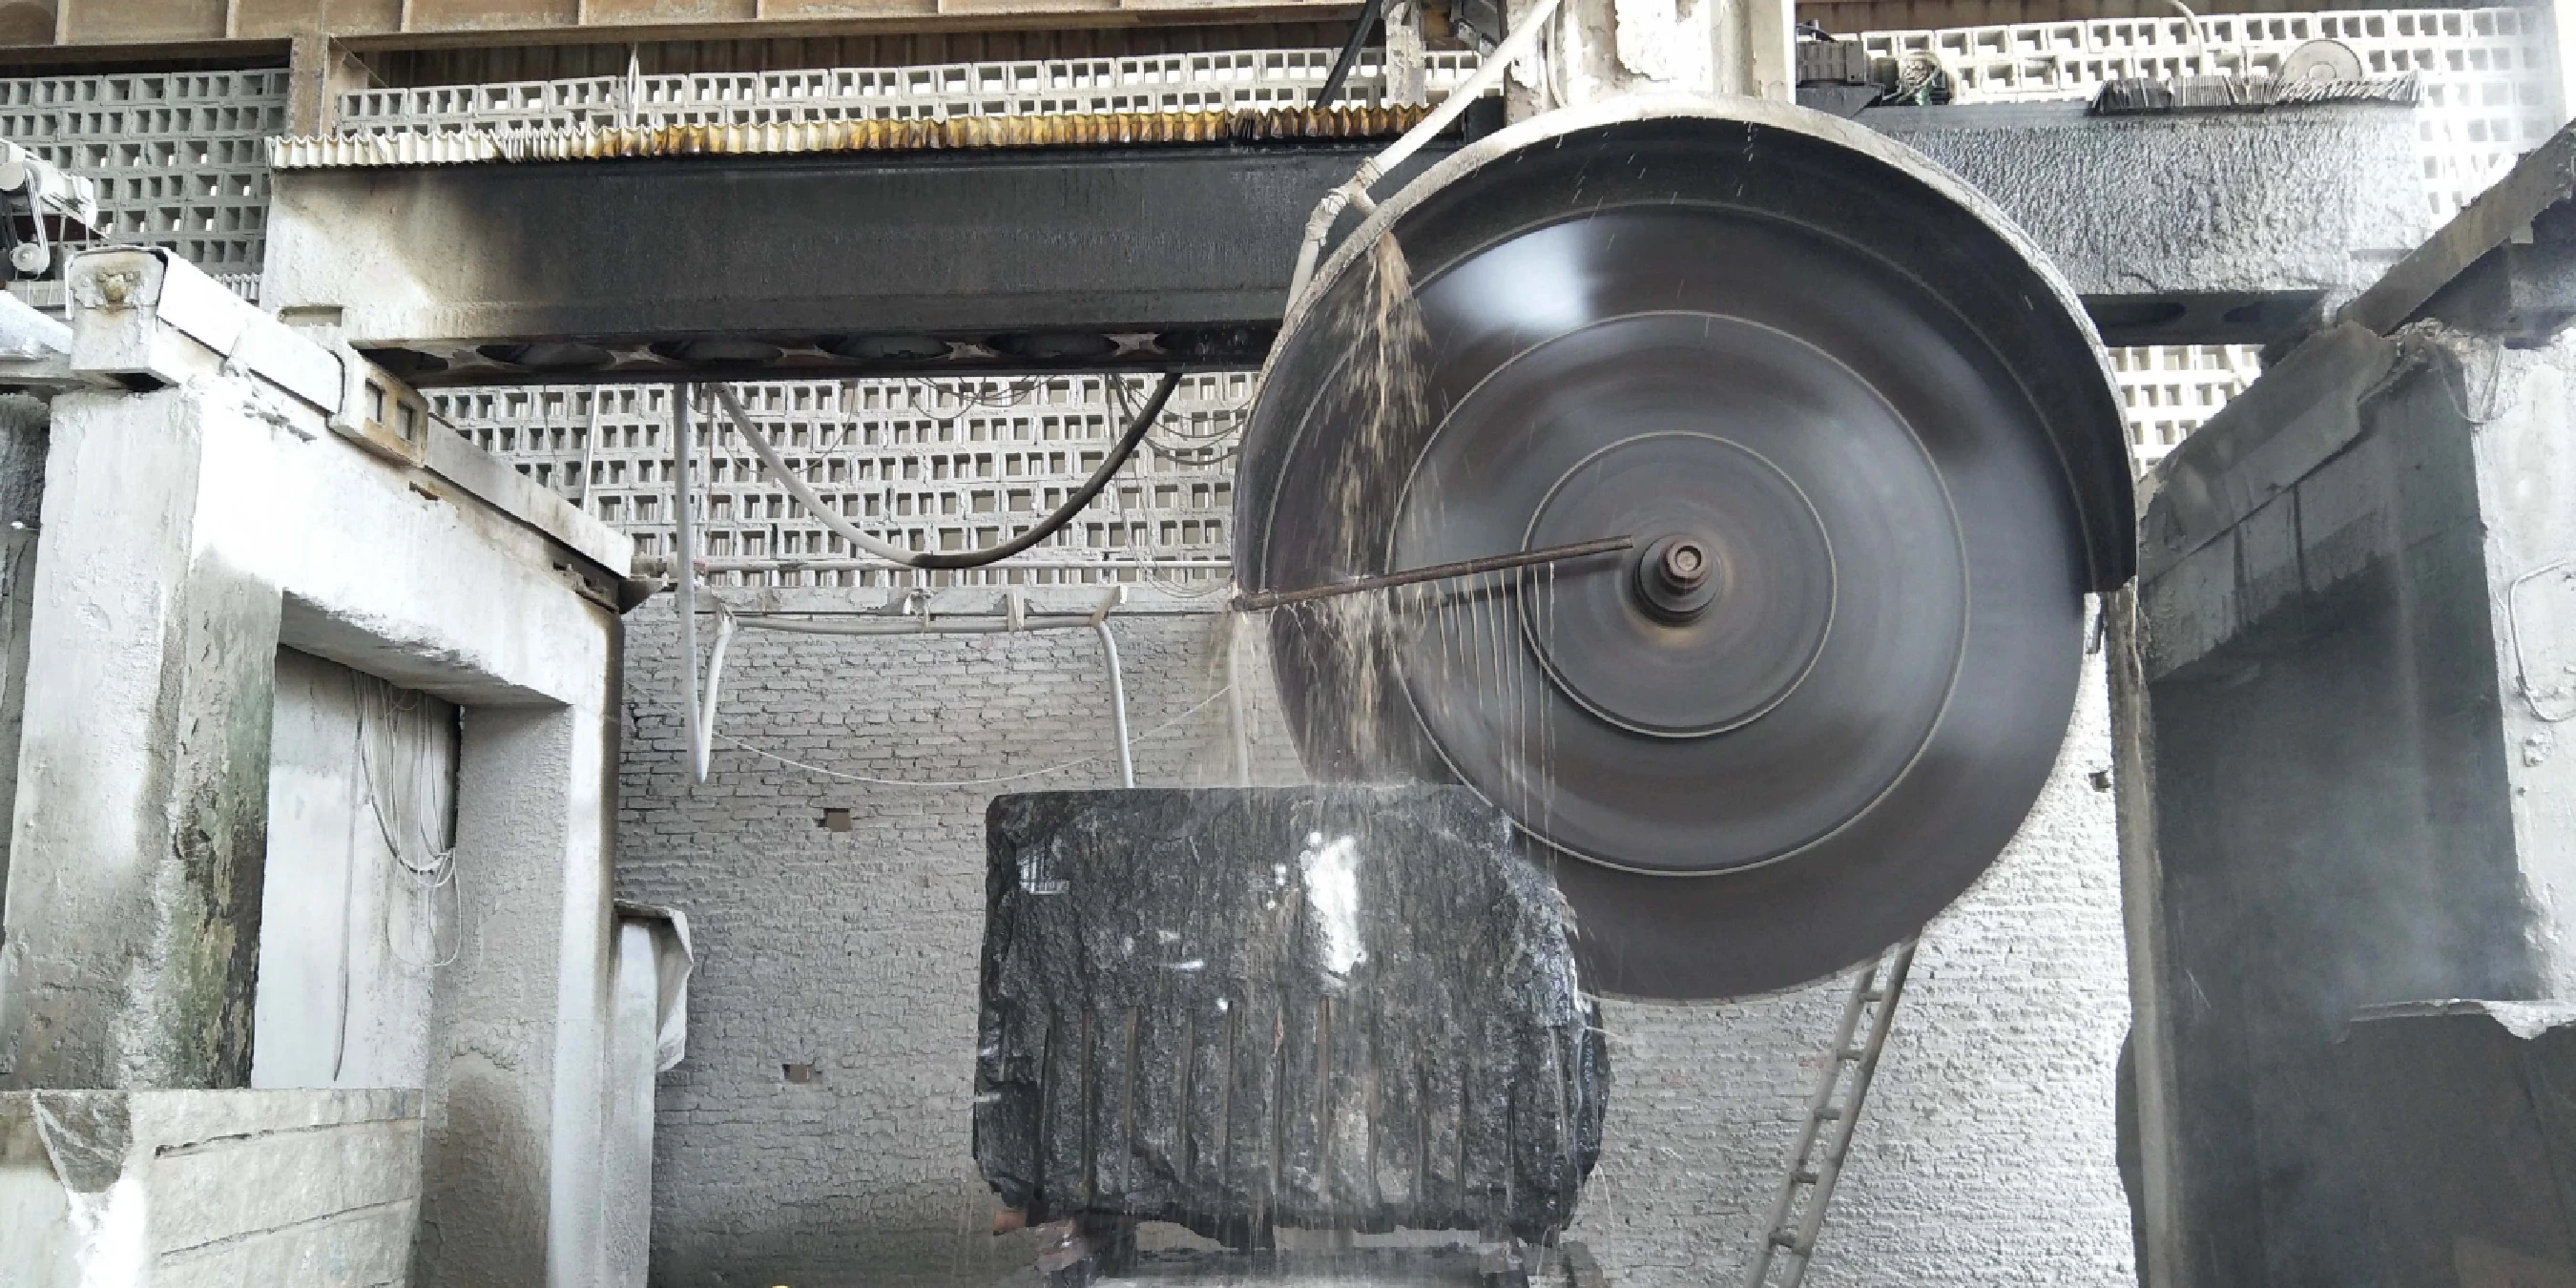
Thesis - A multi-blade stone block cutting machine, stabilized by a cast crossbeam frame and precise guide-post lift, converts diverse granite/marble blocks into predictable slab packs with higher throughput and tighter tolerance (manufacturer-reported). This executive guide distills value levers, a practical rollout roadmap, and risk boundaries.
Executive Summary
- Throughput Gain: A multi-blade setup (up to 32 blades) cuts multiple kerfs in one pass, significantly boosting daily output to a minimum of 300 m² and up to 500 m² (manufacturer-reported).
- Efficiency Focus: For initial block cutting, the primary value is raw output and speed, making it a powerful tool for high-volume quarries and yards.
- Logistics Predictability: Standardized slab packs from scheduled cuts enable reliable on-time shipments and reduce yard congestion.
- The Decision: This is an upgrade for scale. If your bottleneck is block-to-slab conversion speed, especially for applications where raw output is the priority, a 90-day pilot can validate ROI.
Value Model (Business Lens)
- Throughput (Daily Output): A multi-blade block saw with up to 32 blades outperforms single-blade lines. Target: Achieve a daily output of ≥300 m² with a peak of up to 500 m² (manufacturer-reported).
- Blade Economics (Cost per m³): Steadier feed rates and robust QA routines extend blade life. Target: Reduce cost per cubic meter by optimizing blade change intervals and reducing stalls.
- Logistics Predictability: Standardized packs from scheduled runs reduce rework and dispatch delays. Target: Improve on-time shipment rates (as-needed basis).
- Slab Consistency (As-Needed): While secondary to throughput for initial cuts, slab tolerance can be managed to align with downstream requirements.
90-Day Rollout Plan (Pilot → Standardize → Scale)
- Day 1–7 (Setup & Training): Install machine, verify power/water, train operators on SOPs, and run initial calibration cuts on test blocks.
- Day 8–30 (Pilot Execution): Run the pilot on 1–2 chosen diameter bands (e.g., Φ1800/Φ2000). Log all key KPIs: daily output, downtime, and alarm events.
- Day 31–60 (Standardization): Analyze pilot data. Codify maintenance checklists and finalize QA sign-off procedures focused on output consistency.
- Day 61–90 (Replication & Governance): Scale the standardized process to remaining diameter bands. Establish monthly governance reviews and replicate success in other yards.

Acceptance Criteria (Executive-Level)
- Daily Output: Achieve a target daily output of ≥300 m² for pilot diameter bands, with peaks up to 500 m² (manufacturer-reported).
- Jam/Alarm Events: Demonstrate that jams and alarms are handled according to SOPs, minimizing impact on production flow.
- Logistics KPIs: Demonstrate a reduction in loader idle time and an improvement in on-time shipments for pilot SKUs (assessed as-needed).
- Slab Tolerance & Uptime: To be evaluated based on specific downstream needs, not as a primary acceptance criterion for initial cutting.
Risk Register (Top Items)
- Power/Water Quality: Unstable supply can cause electrical faults and poor cooling. Mitigation: Verify supply stability and install appropriate surge protection and filtration.
- Alignment & Maintenance Bandwidth: Lack of routine checks leads to deviation. Mitigation: Implement mandatory daily/weekly checklists and train staff on guide-post clearance checks.
- Safety, PPE & Compliance: Failure to comply risks fines and incidents. Mitigation: Enforce PPE usage, machine guarding, and local dust/slurry disposal regulations.
- Spares Lead Time: Long lead times for blades or bearings can halt production. Mitigation: Establish inventory buffers for critical spares based on historical usage and supplier lead times.
- Training Gaps: Improper operation increases risk of jams and poor quality. Mitigation: Certify operators on SOPs, jam protocols, and changeover procedures.
Governance & Dashboard
- Executive Sponsor: Reviews quarterly output and cost-per-m³ metrics, and overall pilot ROI. Makes scale-up decisions.
- Operations Lead: Reviews monthly reject analysis, on-time shipments, and throughput. Owns SOPs and training updates.
- Maintenance Lead: Reviews weekly jam/alarm events and checklist sign-offs. Owns maintenance schedule and spares inventory.
Cross-References (Read Next)
- Applications & Cases: Multi-blade upgrades lift daily output and cut rejects by stabilizing spacing and kerf targets; see the Applications & Cases article above.
- Technical Principles: Architecture (cast crossbeam, guide-post lift), spindle speed bands (e.g., 455/408/327/287 r/min), and spacing rules; see the Technical Principles article above.
- Selection & Comparison: If-Then tree (precision vs retrofit; marble finish; diameter bands) and neutral lift comparison; see the Selection & Comparison article above.
- O&M Guide: SOPs, Top-10 troubleshooting, maintenance schedule, safety; see the O&M article above.
When discussing specifications or ordering, reference the Stone Block Cutting Machine page naturally within procurement documents.

Frequently Asked Questions
What Should Be Included in a Pilot Plan?
- Chosen diameter bands and target slab thickness per SKU family.
- Acceptance KPI windows: daily output (m²), blade change intervals, logistics KPIs.
- Risk controls: PPE, electrical safety, coolant/slurry handling, QA gates.
How Do We Prove ROI Quickly?
- Compare pilot vs baseline on daily output (m²), rejects, loader idle time, and rework.
- Track cost per m³ and blade life; log downtime by cause to inform maintenance, not as a primary KPI.
How Do We Quantify ROI for Management?
- Throughput Δ: Quantify the increase in daily output from the pilot compared to the baseline (e.g., from X to ≥300 m²).
- Cost per m³ Δ: Calculate the reduction in operational cost, factoring in blade life, energy, and labor.
- Downtime Impact Δ: Measure the reduction in unplanned downtime's impact on output, rather than uptime % itself.
Note: Use a direct pilot-versus-baseline comparison over a 30-day period for a credible business case.
Guide-Post vs Slide Lift - Executive Takeaway?
- Guide-post: Higher precision for multi-blade and hard stone; lower deviation.
- Slide: Retrofit-friendly but needs heavier alignment QA; choose by tolerance target and budget.
What Changes in Governance After Standardization?
- Freeze spacing per SKU; formalize SOPs; add monthly audits for rpm/spacing.
- Use jam/alarm analytics to tune feed and maintenance windows.
Which Metrics Belong in Executive Dashboards?
- Throughput (daily m²), cost per m³.
- On-time shipments, rework rate, blade change intervals, safety incidents.


 English
 中文
中文


